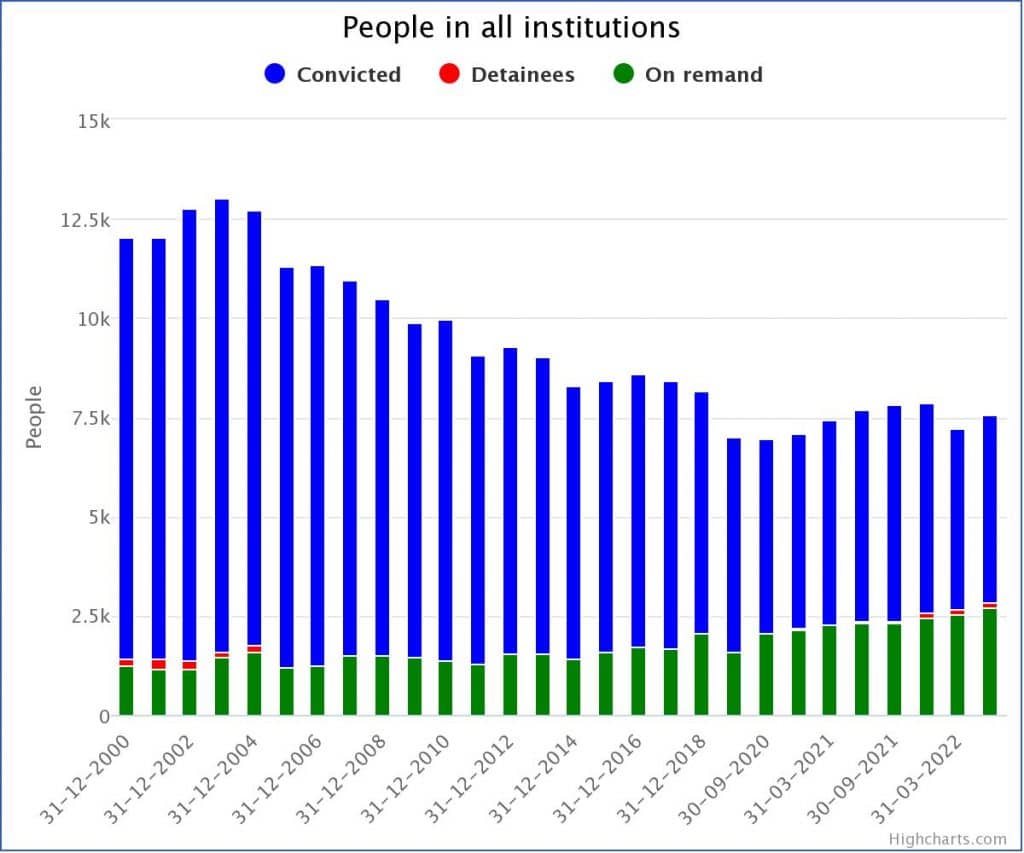
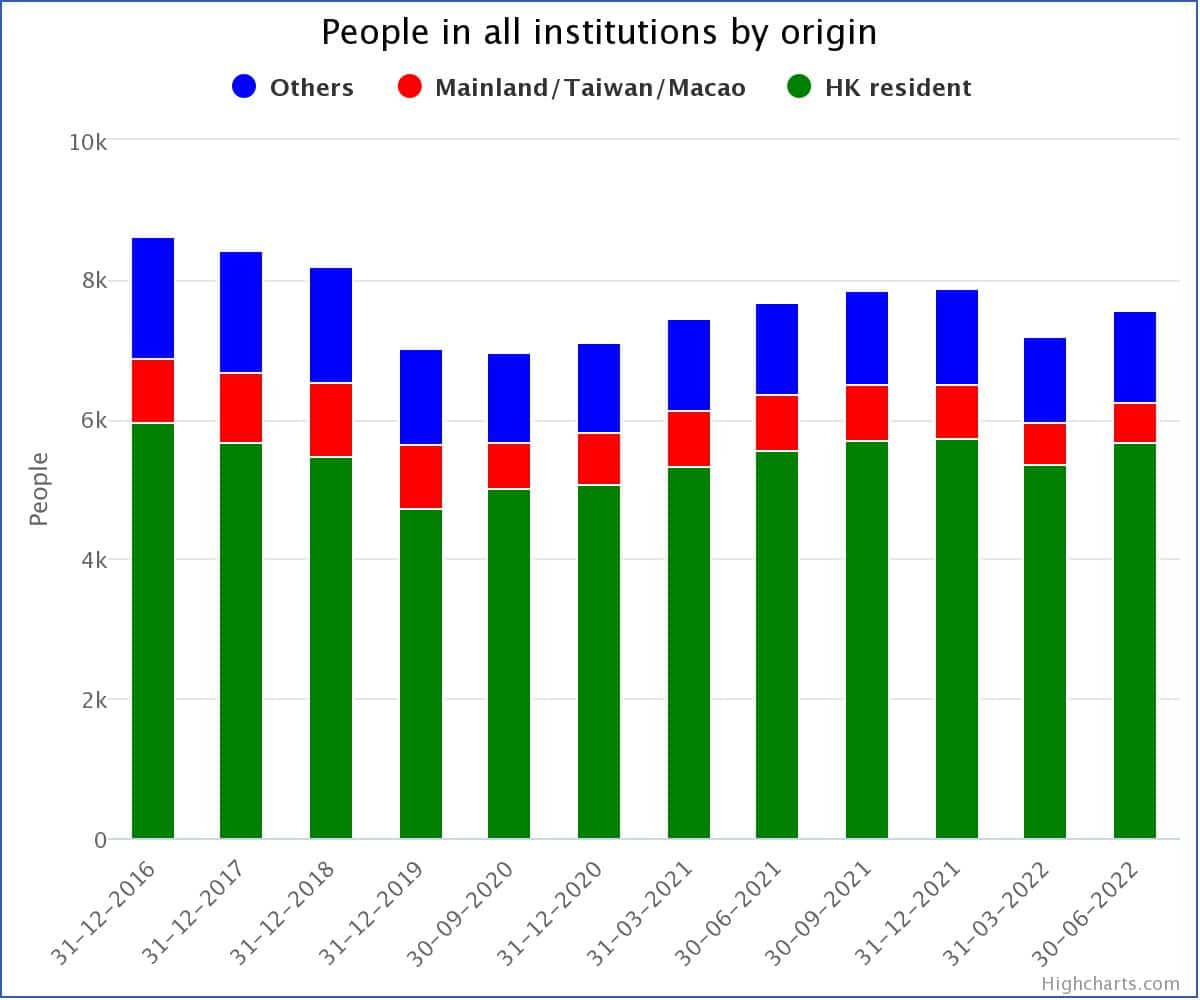
This page shows the number of people in custody in facilities managed by the Hong Kong Correctional Services Department, including prisons. People on remand are innocent until proven guilty and are awaiting trial. Detainees are held under the Immigration Ordinance.
Figures are annual from 31-Dec-2000 and quarterly from 30-Sep-2020 and will be updated when published online by CSD – we check daily. The breakdown of prisoners by place of origin is only available from 2016 onwards, as a sum across all institutions.
People in all institutions
| Date | Convict | Remand | Detain | Total | Convict % |
Remand % |
Detain % |
|---|---|---|---|---|---|---|---|
| 2022-06-30 | 4,731 | 2,701 | 124 | 7,556 | 62.61 | 35.75 | 1.64 |
| 2022-03-31 | 4,550 | 2,552 | 103 | 7,205 | 63.15 | 35.42 | 1.43 |
| 2021-12-31 | 5,307 | 2,462 | 98 | 7,867 | 67.46 | 31.30 | 1.25 |
| 2021-09-30 | 5,465 | 2,303 | 72 | 7,840 | 69.71 | 29.38 | 0.92 |
| 2021-06-30 | 5,319 | 2,302 | 67 | 7,688 | 69.19 | 29.94 | 0.87 |
| 2021-03-31 | 5,167 | 2,279 | 0 | 7,446 | 69.39 | 30.61 | 0.00 |
| 2020-12-31 | 4,919 | 2,166 | 22 | 7,107 | 69.21 | 30.48 | 0.31 |
| 2020-09-30 | 4,901 | 2,056 | 1 | 6,958 | 70.44 | 29.55 | 0.01 |
| 2019-12-31 | 5,424 | 1,599 | 0 | 7,023 | 77.23 | 22.77 | 0.00 |
| 2018-12-31 | 6,135 | 2,044 | 2 | 8,181 | 74.99 | 24.98 | 0.02 |
| 2017-12-31 | 6,728 | 1,695 | 0 | 8,423 | 79.88 | 20.12 | 0.00 |
| 2016-12-31 | 6,898 | 1,713 | 0 | 8,611 | 80.11 | 19.89 | 0.00 |
| 2015-12-31 | 6,856 | 1,582 | 0 | 8,438 | 81.25 | 18.75 | 0.00 |
| 2014-12-31 | 6,885 | 1,412 | 0 | 8,297 | 82.98 | 17.02 | 0.00 |
| 2013-12-31 | 7,507 | 1,532 | 0 | 9,039 | 83.05 | 16.95 | 0.00 |
| 2012-12-31 | 7,738 | 1,559 | 0 | 9,297 | 83.23 | 16.77 | 0.00 |
| 2011-12-31 | 7,761 | 1,306 | 0 | 9,067 | 85.60 | 14.40 | 0.00 |
| 2010-12-31 | 8,622 | 1,365 | 1 | 9,988 | 86.32 | 13.67 | 0.01 |
| 2009-12-31 | 8,425 | 1,455 | 2 | 9,882 | 85.26 | 14.72 | 0.02 |
| 2008-12-31 | 8,978 | 1,510 | 3 | 10,491 | 85.58 | 14.39 | 0.03 |
| 2007-12-31 | 9,426 | 1,519 | 1 | 10,946 | 86.11 | 13.88 | 0.01 |
| 2006-12-31 | 10,112 | 1,252 | 0 | 11,364 | 88.98 | 11.02 | 0.00 |
| 2005-12-31 | 10,125 | 1,186 | 0 | 11,311 | 89.51 | 10.49 | 0.00 |
| 2004-12-31 | 10,955 | 1,604 | 146 | 12,705 | 86.23 | 12.62 | 1.15 |
| 2003-12-31 | 11,405 | 1,452 | 155 | 13,012 | 87.65 | 11.16 | 1.19 |
| 2002-12-31 | 11,390 | 1,174 | 180 | 12,744 | 89.38 | 9.21 | 1.41 |
| 2001-12-31 | 10,651 | 1,169 | 234 | 12,054 | 88.36 | 9.70 | 1.94 |
| 2000-12-31 | 10,584 | 1,252 | 181 | 12,017 | 88.08 | 10.42 | 1.51 |
People in all institutions
| Date | HK res. |
CN/TW /MO |
Other | Total | HK res. % |
CN/TW /MO% |
Other % |
|---|---|---|---|---|---|---|---|
| 2022-06-30 | 5,678 | 562 | 1,316 | 7,556 | 75.15 | 7.44 | 17.42 |
| 2022-03-31 | 5,362 | 590 | 1,253 | 7,205 | 74.42 | 8.19 | 17.39 |
| 2021-12-31 | 5,743 | 748 | 1,376 | 7,867 | 73.00 | 9.51 | 17.49 |
| 2021-09-30 | 5,710 | 780 | 1,350 | 7,840 | 72.83 | 9.95 | 17.22 |
| 2021-06-30 | 5,552 | 811 | 1,325 | 7,688 | 72.22 | 10.55 | 17.23 |
| 2021-03-31 | 5,337 | 803 | 1,306 | 7,446 | 71.68 | 10.78 | 17.54 |
| 2020-12-31 | 5,084 | 740 | 1,283 | 7,107 | 71.54 | 10.41 | 18.05 |
| 2020-09-30 | 5,021 | 664 | 1,273 | 6,958 | 72.16 | 9.54 | 18.30 |
| 2019-12-31 | 4,736 | 910 | 1,377 | 7,023 | 67.44 | 12.96 | 19.61 |
| 2018-12-31 | 5,484 | 1,044 | 1,653 | 8,181 | 67.03 | 12.76 | 20.21 |
| 2017-12-31 | 5,663 | 1,026 | 1,734 | 8,423 | 67.23 | 12.18 | 20.59 |
| 2016-12-31 | 5,958 | 927 | 1,726 | 8,611 | 69.19 | 10.77 | 20.04 |


